Quick Start: Tradomate Screener Backtesting
The Screener Backtest in Tradomate, powered by Dynamic Returns, helps you understand how your strategies perform across different holding periods. It identifies optimal timeframes, best-performing stocks and sectors, and the risk-to-reward profile of your screener.
Unlike static backtests that use one fixed exit period, Dynamic Returns evaluates multiple holding periods automatically, showing when your trades historically performed best.
With Tradomate, you don’t just see if a strategy works, you understand when it works best and where it works best.
Walkthrough Video
Section titled “Walkthrough Video”Before diving into metrics and filters, here’s a quick walkthrough of the Dynamic Returns workflow on Tradomate, from running a screen to interpreting your performance across holding periods.
How to Access Backtesting
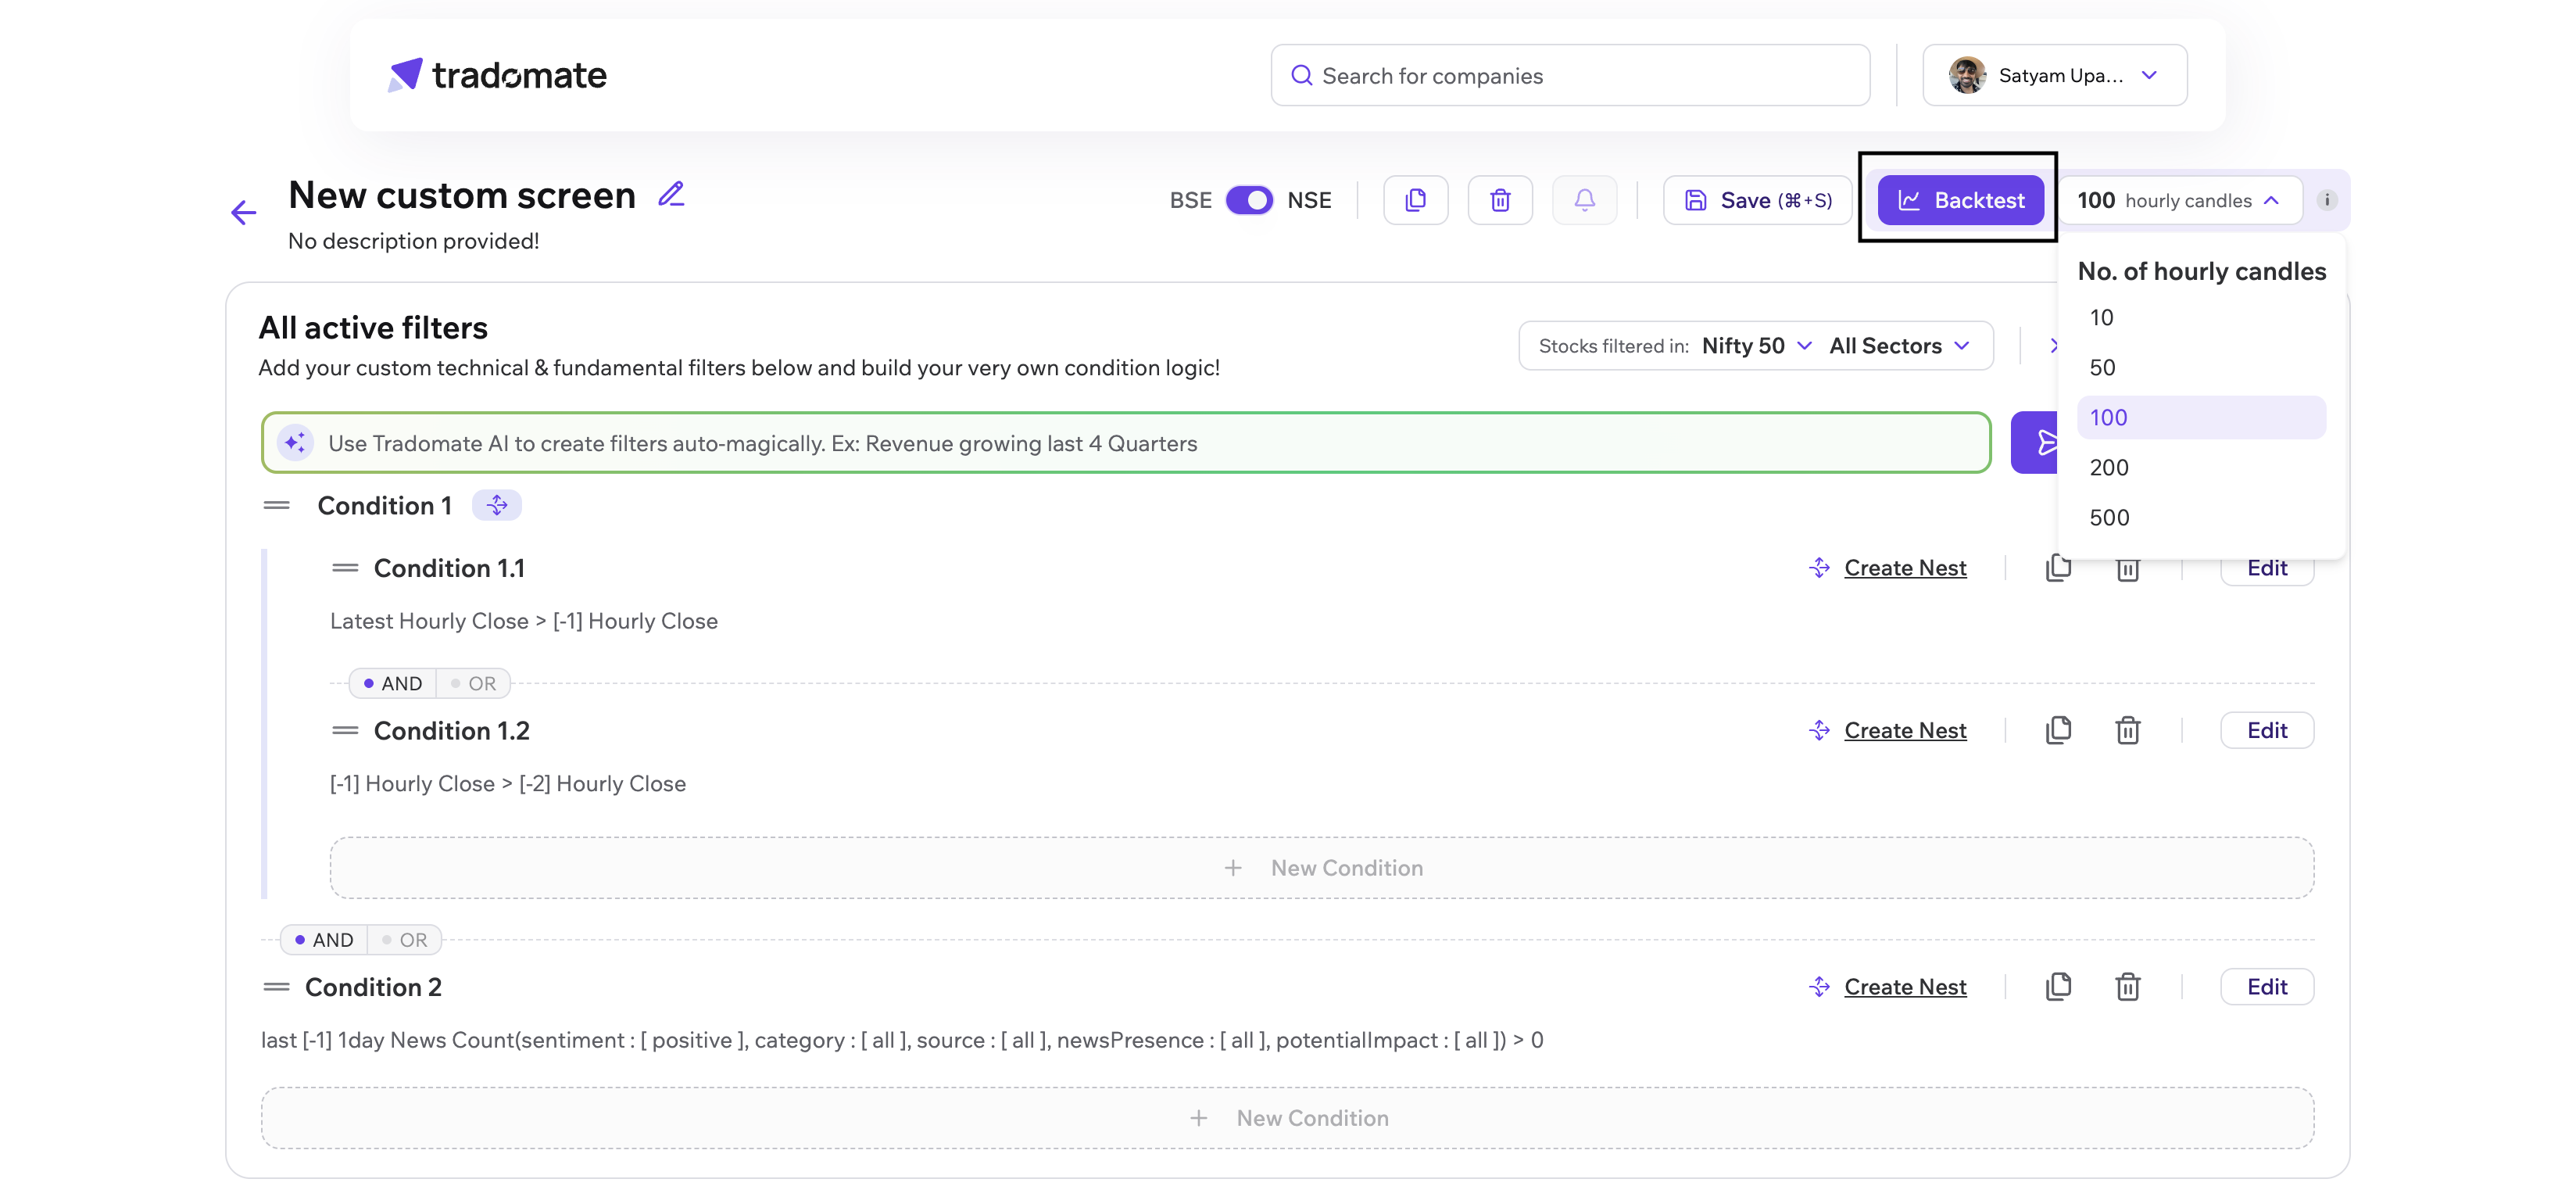
Section titled “How to Access Backtesting”After running any screener, click the Backtest button available at the top-right of the Screener page or inside the results section. You can also choose a backtest window between 10 candles to 500 candles.
Step-by-Step Guide to Understanding Backtest Results
Section titled “Step-by-Step Guide to Understanding Backtest Results”1. Access Dynamic Returns
Section titled “1. Access Dynamic Returns”After running a backtest, results are divided into two sections:
- Overview Tab for summarized insights
- Deep Dive Tab for detailed stock-level analysis
We call these Dynamic Returns as they showcase a range of returns over different holding periods.
You can navigate between both tabs to analyze your screener fully.
2. Understand Key Metrics
Section titled “2. Understand Key Metrics”Dynamic Returns calculates multiple performance indicators to quantify both profitability and reliability. Here’s what each of them means:
| Metric | Definition |
|---|---|
| MFE (Maximum Favourable Expectancy) | The best return achieved during the trade’s lifespan. Represents potential upside. |
| MAE (Maximum Adverse Expectancy) | The worst return (drawdown) observed before a trade turned profitable or was closed. Represents downside exposure. |
| Holding Period | The most optimal holding period on past returns. |
All metrics are calculated using historical occurrences where the same screener conditions appeared on the same stock.
Backtest Overview Screen
Section titled “Backtest Overview Screen”The Overview tab presents a summarized view of your screen’s backtest performance, showing which stocks and sectors have historically delivered the strongest results.
Historical Performance & Returns
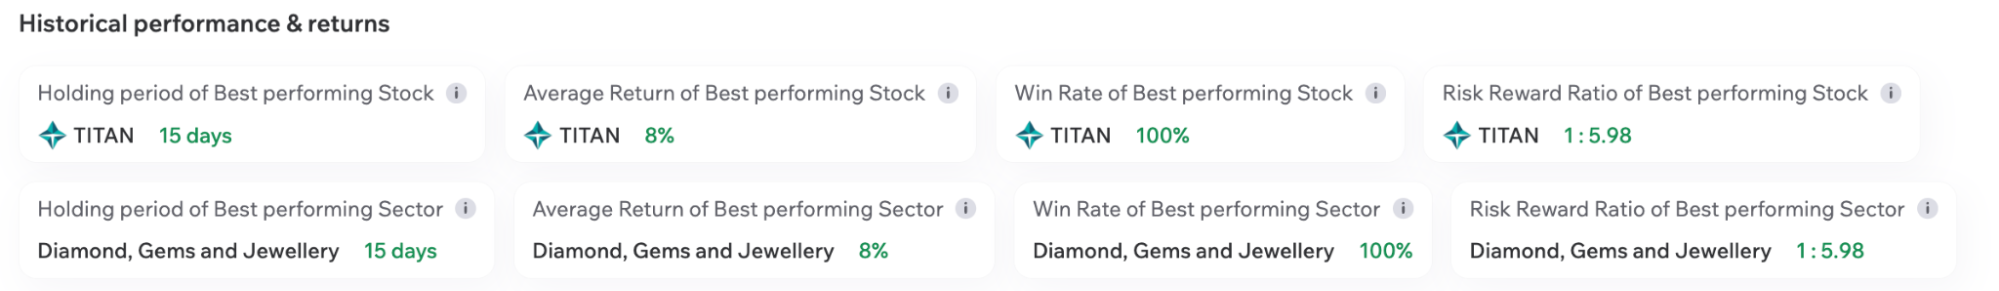
Section titled “Historical Performance & Returns”At the top of the Overview screen, key performance cards summarize your strongest results:
- Best Performing Stock: The stock that delivered the highest return based on its optimal holding period.
- Average Return of Best Performing Stock: The mean return (%) for that period.
- Win Rate of Best Performing Stock: The percentage of successful backtested instances.
Similarly, sector-level cards show:
- Best Performing Sector (Example: Defence, Gems & Jewellery)
- Average Return, Win Rate, and Risk-Reward Ratio for that sector.
These cards help quickly identify where your screen historically performed strongest across both stocks and sectors.
Visual Analysis
Section titled “Visual Analysis”Scatter Plot: Win Rate vs Average Returns vs Occurrences
Section titled “Scatter Plot: Win Rate vs Average Returns vs Occurrences”Dynamic Returns plots a 3D scatter view to help visualize how each stock performed relative to others.
- Each point/bubble represents a stock.
- X-axis → Win Rate
- Y-axis → Average Returns
- Bubble size → Number of Occurrences
Traders can hover over any bubble to view:
- Stock name
- Number of occurrences
- Best holding period
- Average returns
- Win rate
Stock Performance Across Holding Periods
Section titled “Stock Performance Across Holding Periods”Next to the scatter chart, the Stock performance across holding periods section illustrates the historical behavior of the top companies identified by your screener across various holding periods.
Key Features for Traders:
- Metric Toggle: Switch between Returns and Win Rate using the top-right dropdown.
- Stock Search: Easily search for any stock matched by the screener.
- Comparative Analysis: Compare stock performance across different holding periods.
- Detailed View: Hover over the sparkline points to view exact performance values.
Visual Indicators:
- Green segments signify positive performance.
- Red segments signify negative performance.
Dynamic Adjustment:
- Holding periods automatically adjust based on your screener’s timeframe.
This view is essential for comparing stock responses to varied holding durations, helping you pinpoint where your screener has historically yielded the best results.
Backtest Deep Dive Screen
Section titled “Backtest Deep Dive Screen”The Deep Dive tab allows you to inspect backtest performance in more detail across timeframe, stock, sector, and occurrence frequency.
1. Heatmap - Timeline View
Section titled “1. Heatmap - Timeline View”Visualize how your strategy performed across different holding periods. Each cell’s color represents average return intensity and no. of occurrences, helping you spot profitable time zones.
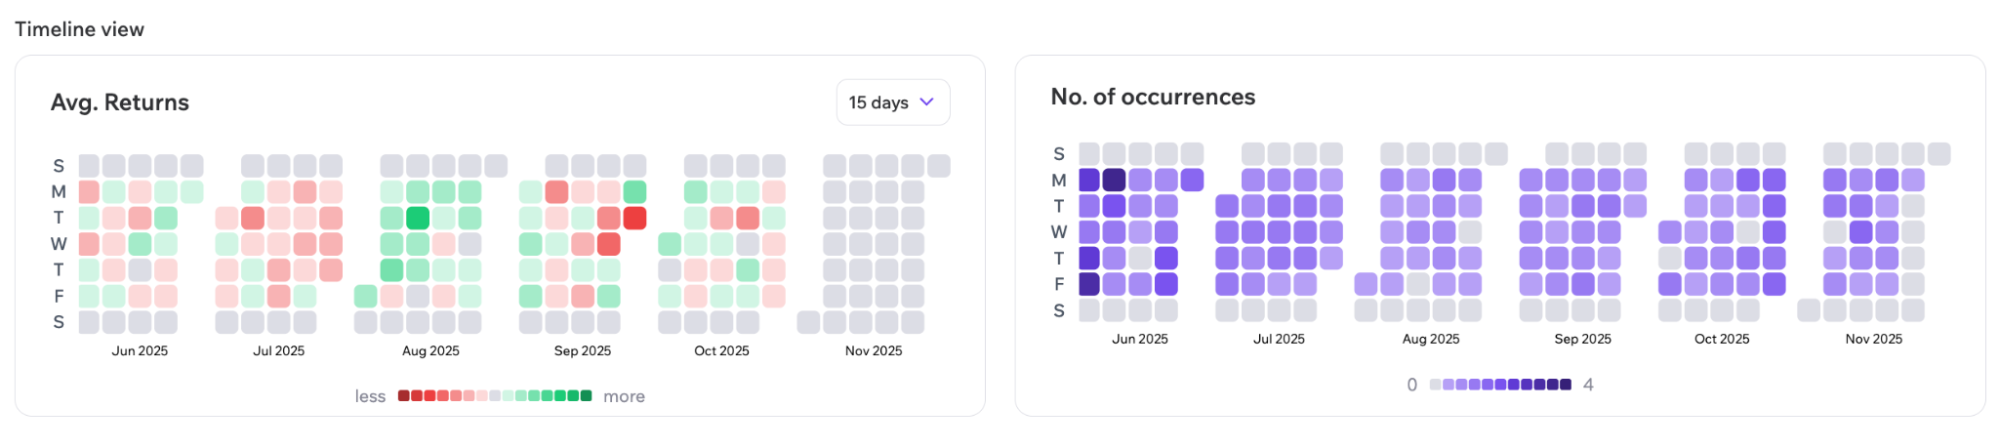
Use the dropdown selector to choose which holding period you want to evaluate. The heatmap updates accordingly.
2. Deep Dive Table - Performance View
Section titled “2. Deep Dive Table - Performance View”This table lists stock-level backtest results with sortable metrics and advanced performance insights.
| Column | Description |
|---|---|
| Stock | Company matched by screener |
| Sector | Sector classification |
| Market Cap | Company market capitalization |
| No. of Times Screened | Historical occurrences of this setup |
| Best Holding Period | Most efficient historical duration |
| Returns | Avg returns across holding periods |
| Win Rate | Positive occurrence rate |
| TP | Estimated upside target |
| SL | Estimated downside risk |
Performance Tools
Section titled “Performance Tools”Users can:
- Search any company
- Sort by any column
- Filter by stock or sector
- Sort by occurrences to identify repeat setups
Each row displays:
- Returns curve across holding periods
- Win Rate curve across holding periods
- Best historical holding period
- Estimated TP and SL levels
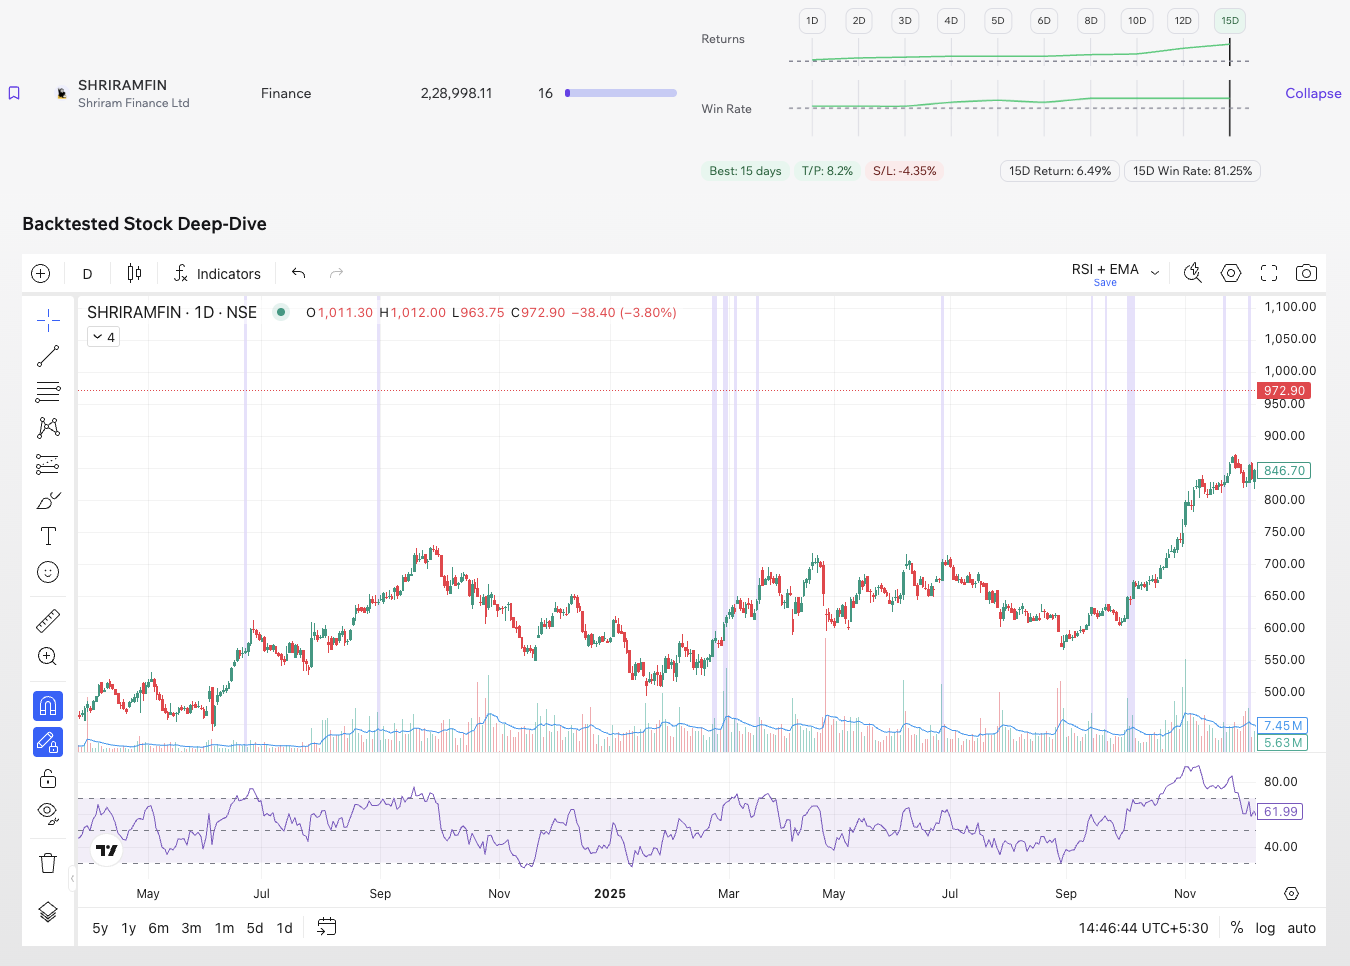
Expand Chart View
Section titled “Expand Chart View”The last column in the Performance View table is “Details”. Under Details, you will see an “Expand” button on every stock row to open a detailed chart view. Historical occurrences of the same screener setup are marked using purple vertical lines, allowing visual review of past setups.
Why Dynamic Returns Matters
Section titled “Why Dynamic Returns Matters”With Dynamic Returns, you move beyond static screens into strategy validation.
It helps answer questions like:
- Does this screen work historically?
- Which stocks perform best?
- What holding period gives the strongest results?
- How often does the setup appear?
- What risk-reward profile does it offer?
This helps traders improve entries, exits, conviction, and risk management using historical evidence instead of guesswork.
Start exploring your screen’s full performance spectrum today and continue to #tradeIntelligently.