What Is a Cup and Handle Pattern: Everything You Need To Know
The cup and handle is a bullish continuation chart pattern. Learn how it forms, what it signals, and how to find it on stocks and the screener on Tradomate.
The cup and handle is a chart pattern with two parts: the cup and the handle.
It is called a bullish continuation pattern. This means it hints that a stock that has been rising may keep rising after a pause.
The pattern was introduced by William O’Neil, the founder of Investor’s Business Daily, in his 1988 book How to Make Money in Stocks.
The pattern forms in three parts.
- The cup: The price falls, bottoms out, and climbs back to near where the fall began.
- The handle: The price then dips again and drifts slightly lower.
- The breakout: The price moves above the handle’s high. Traders treat this as the confirmation of the pattern.
- The name: The shape looks like a teacup seen from the side. This is where the name comes from.
What Does the Cup and Handle Pattern Signal?
Traders look at a few things along with the pattern.
- Trend age: If the rise before the cup has gone on for a very long time, the pattern is less likely to lead to a continuation.
- Volume: Volume usually falls while the cup and handle form. A clear rise in volume when the price breaks above the handle is seen as a stronger sign.
- Market mood: The pattern tends to hold up less well when the overall market is falling.
How to Find the Cup and Handle Pattern on Stocks on Tradomate?
- Chart: Open a stock’s company page and under the technical tab, the price chart sits under the Performance overview section.
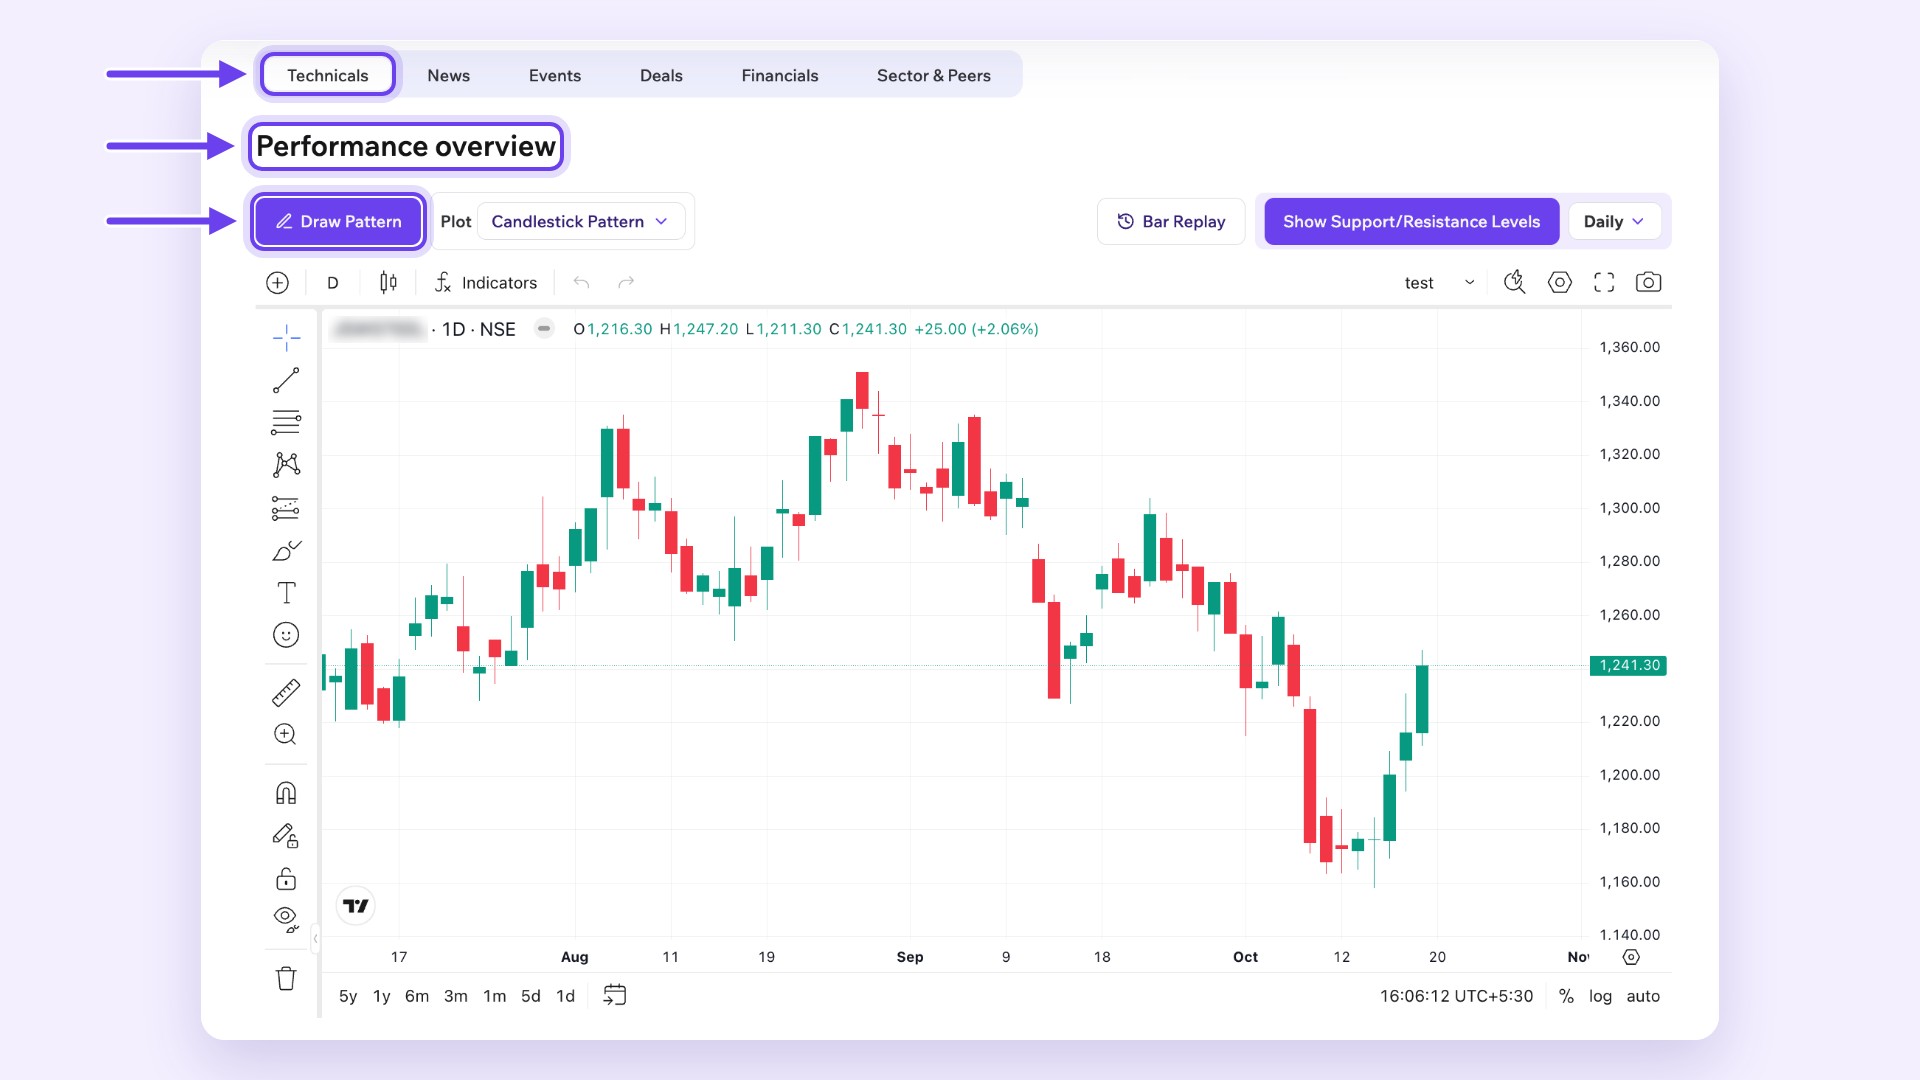
- Draw Pattern: Click Draw Pattern above the chart. A panel opens with two tabs, Bullish Patterns and Bearish Patterns.
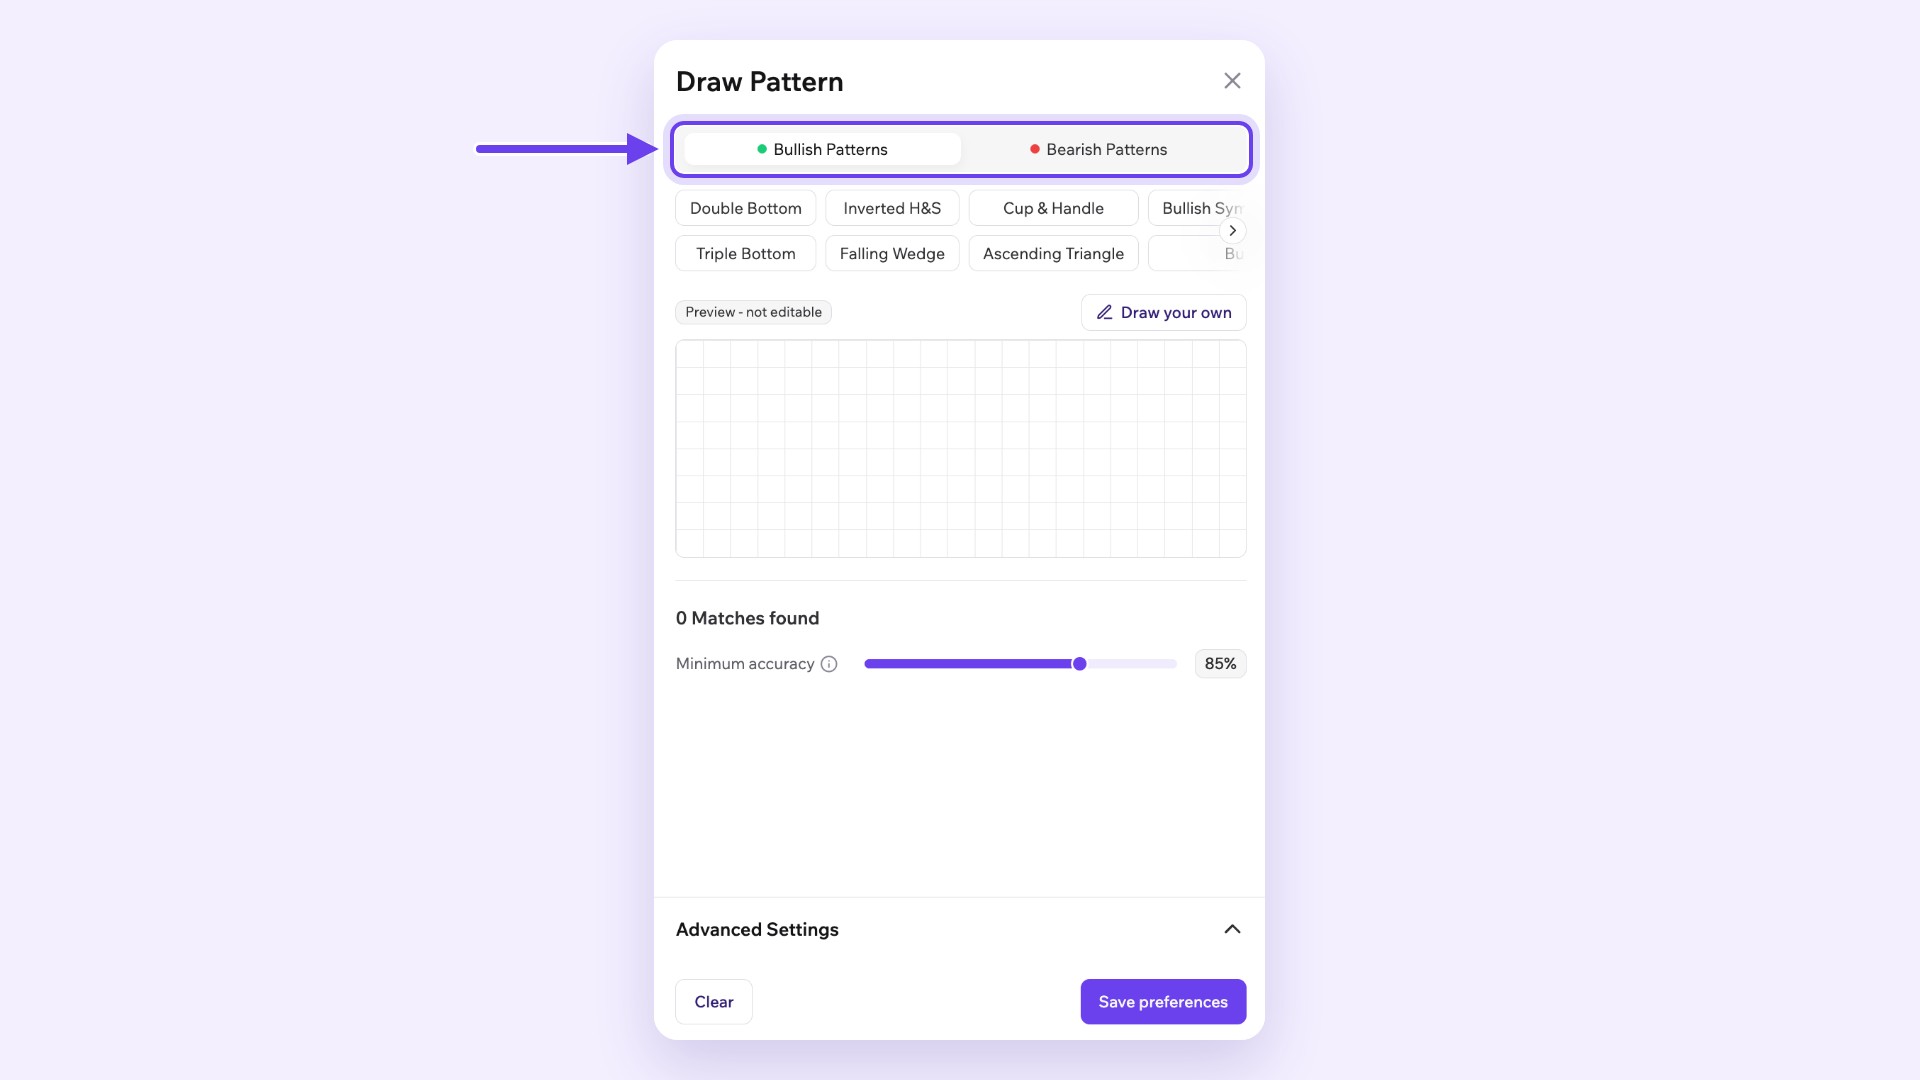
- Minimum accuracy: The Minimum accuracy slider sets how close a match must be before it is shown.
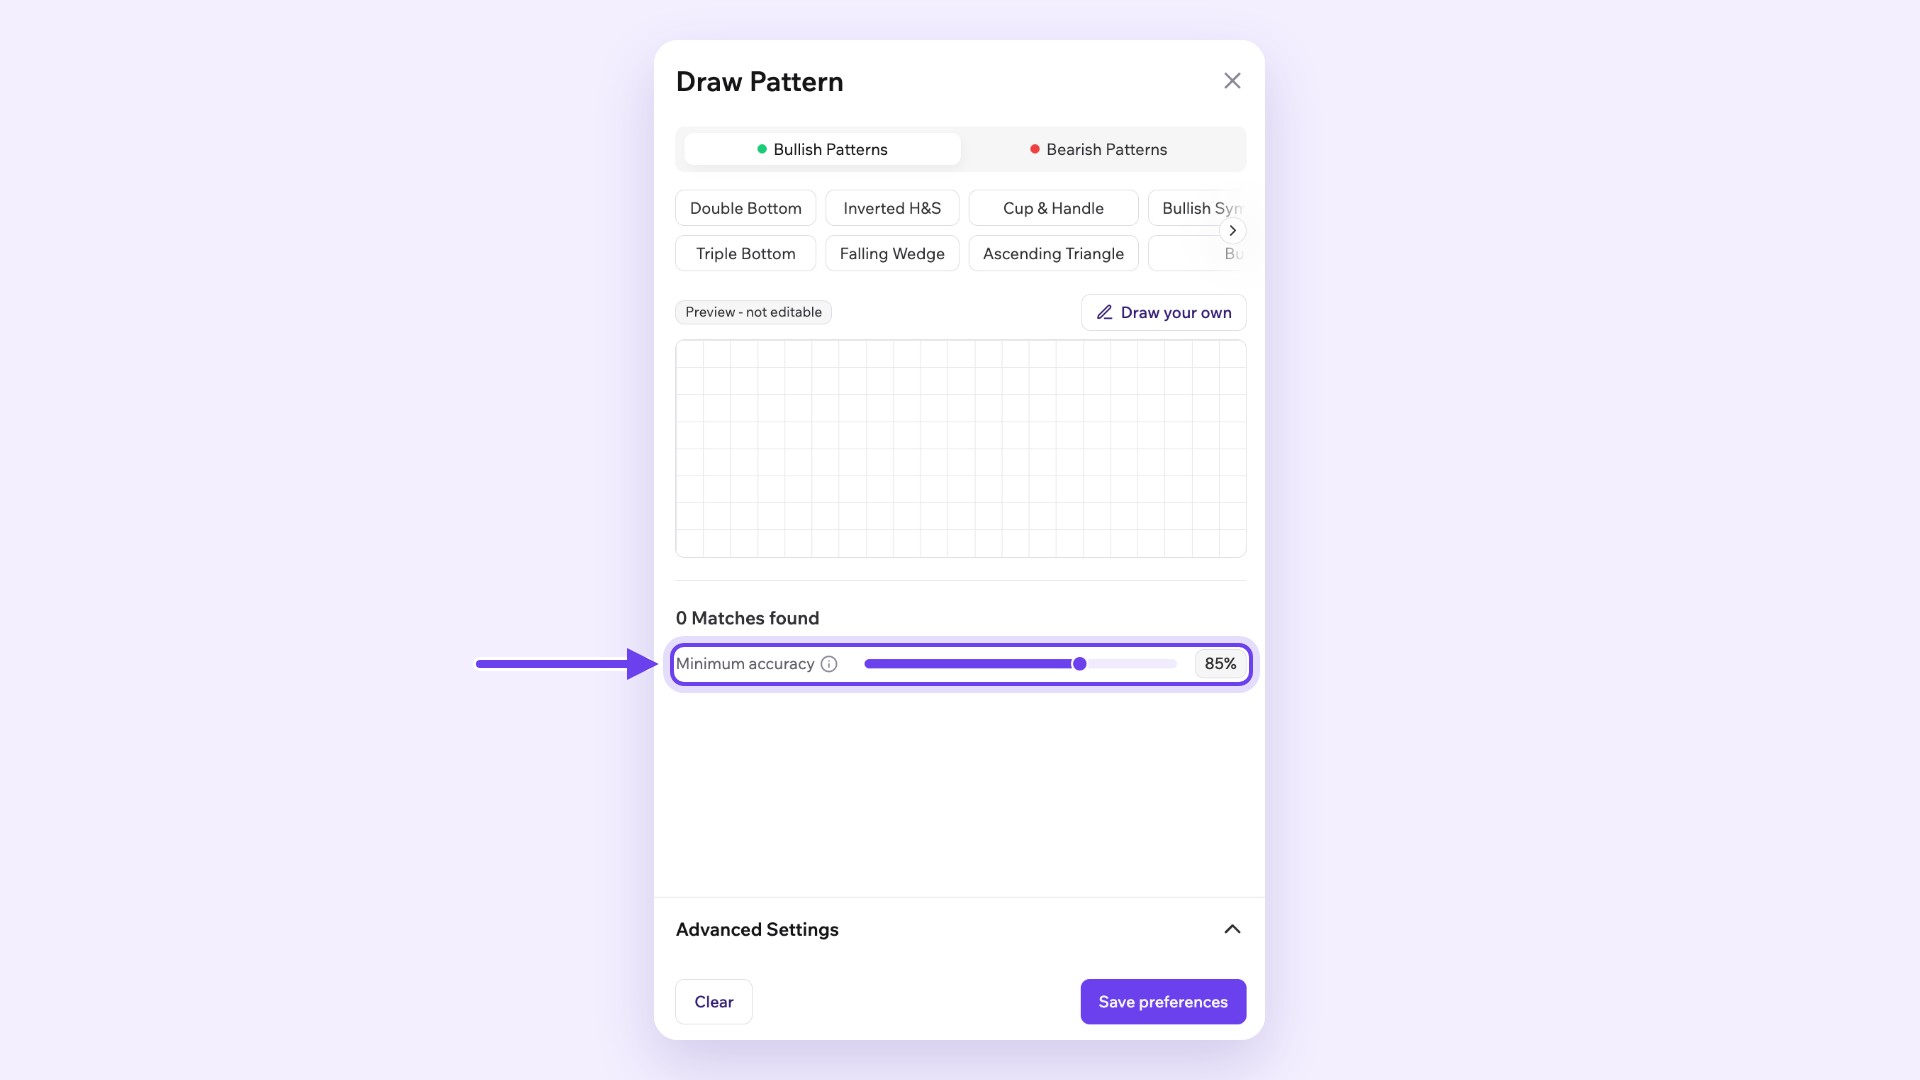
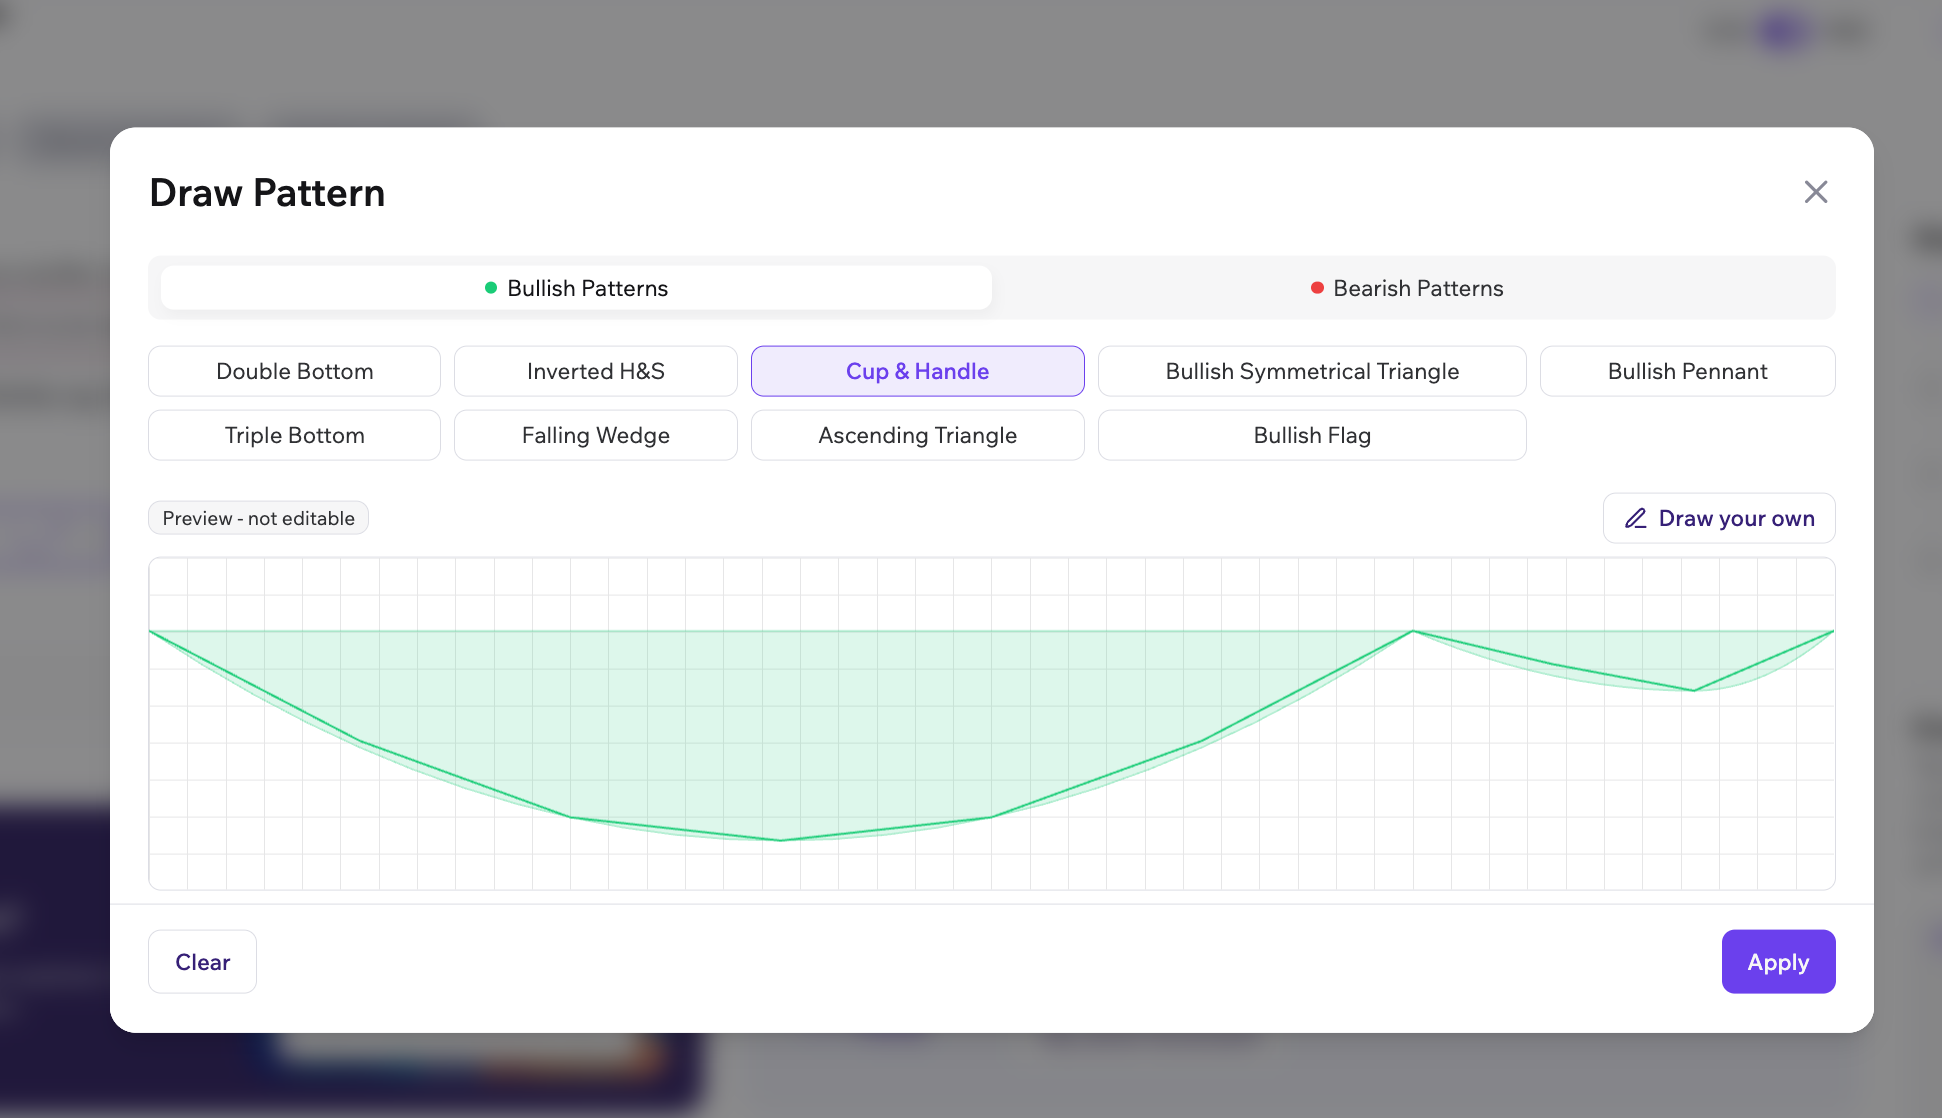
- Select the pattern: Cup & Handle is in the Bullish Patterns tab. Select it to see a preview of its shape.
- Matches: Tradomate lists the matches it finds, each with a date and time.
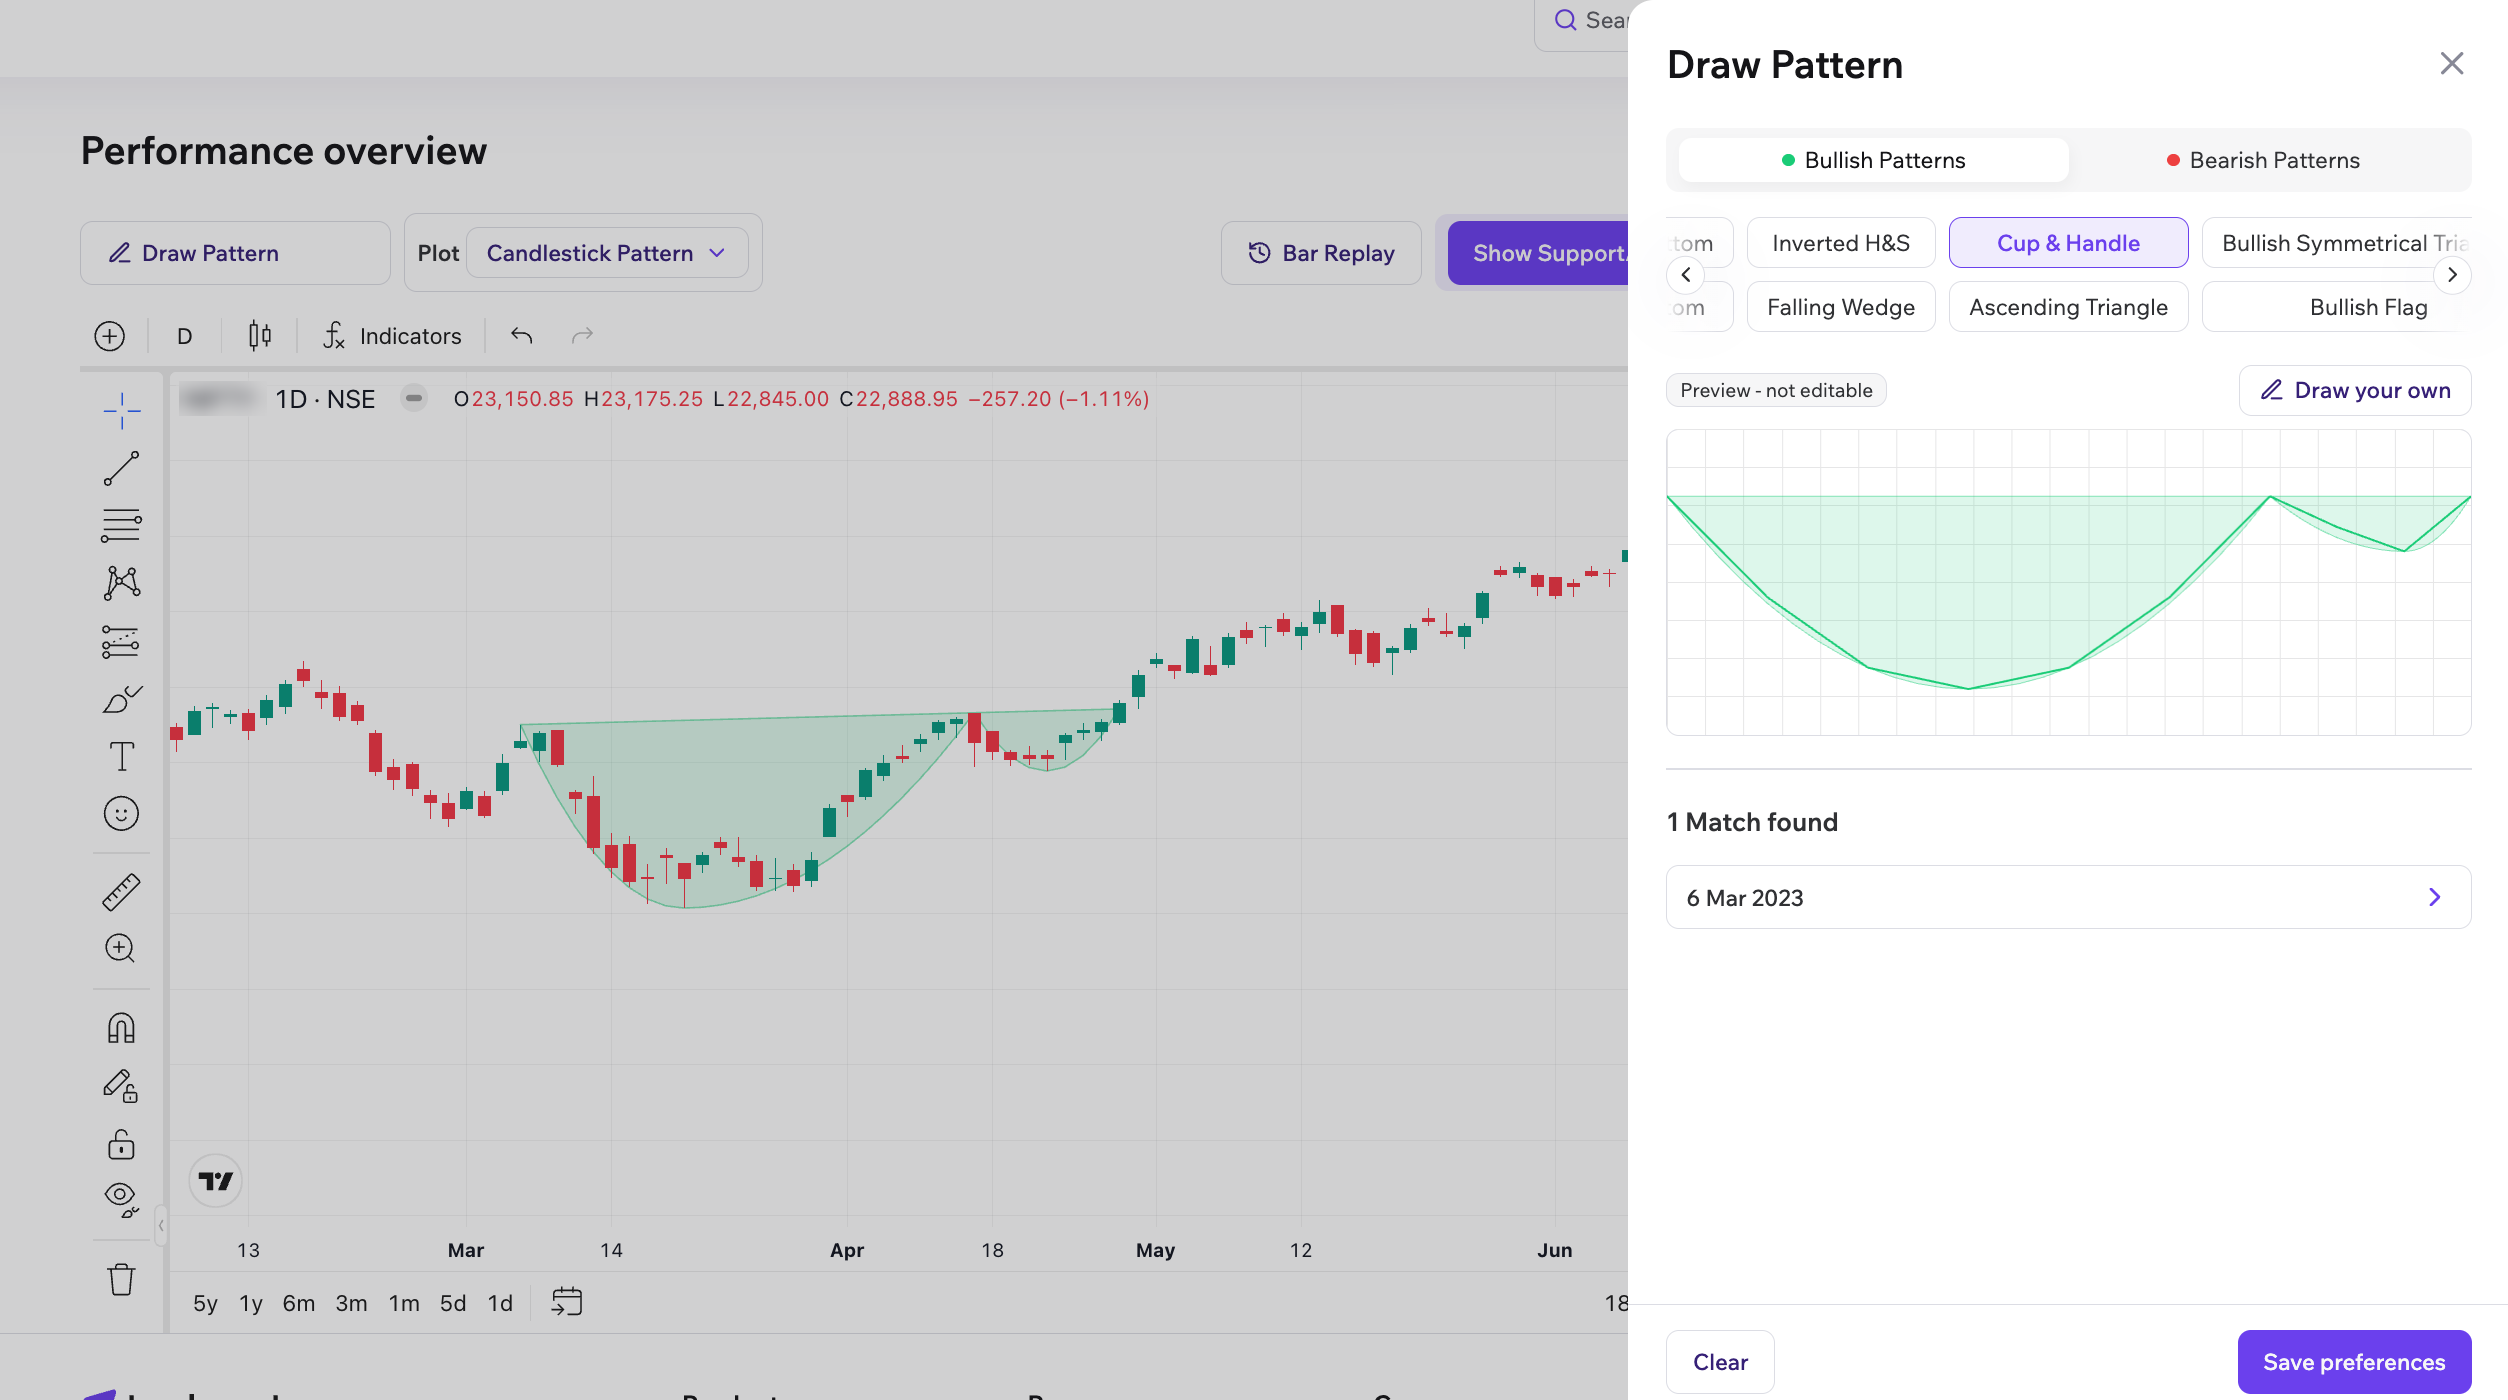
- Draw your own: You can also draw your own shape with the Free-hand or Line tool, and Tradomate finds matches for it.
How to Find the Cup and Handle Pattern on Screener on Tradomate?
- Custom screen: Open the Screener and start a new custom screen.
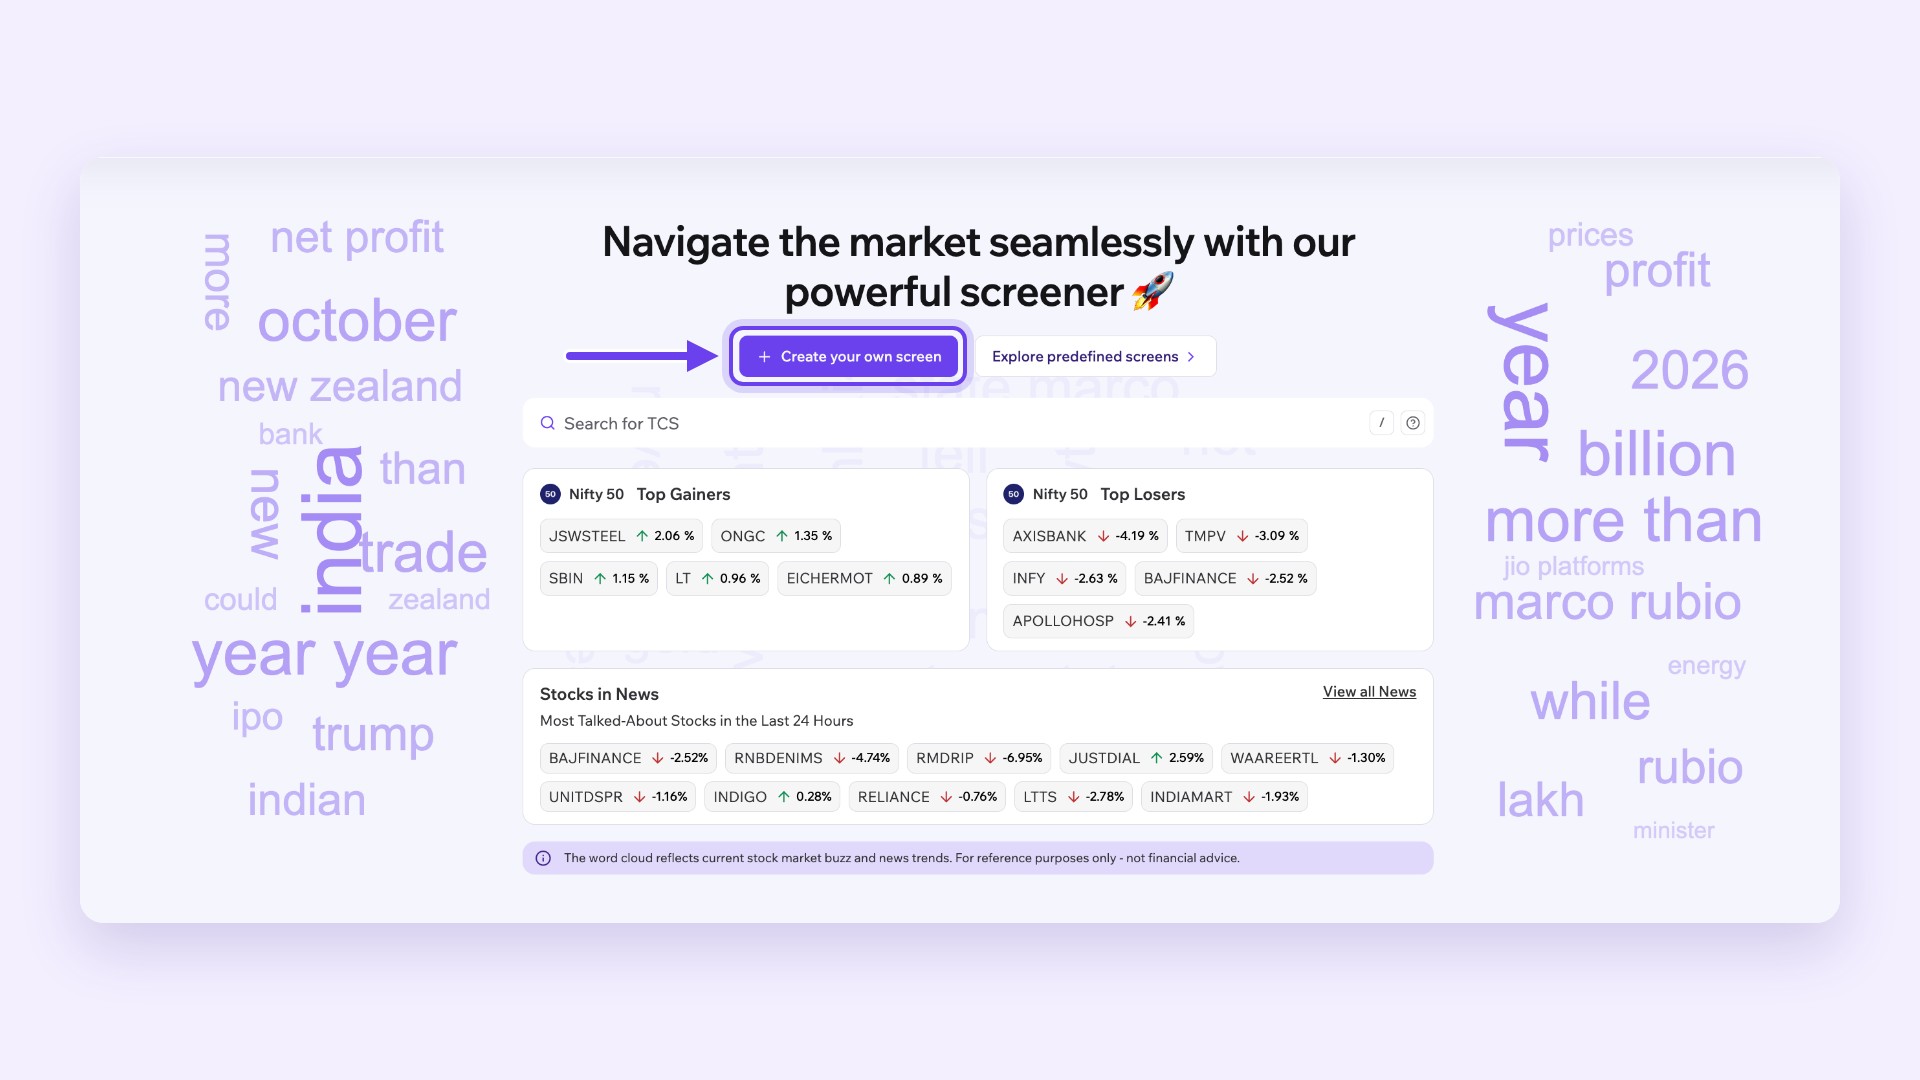
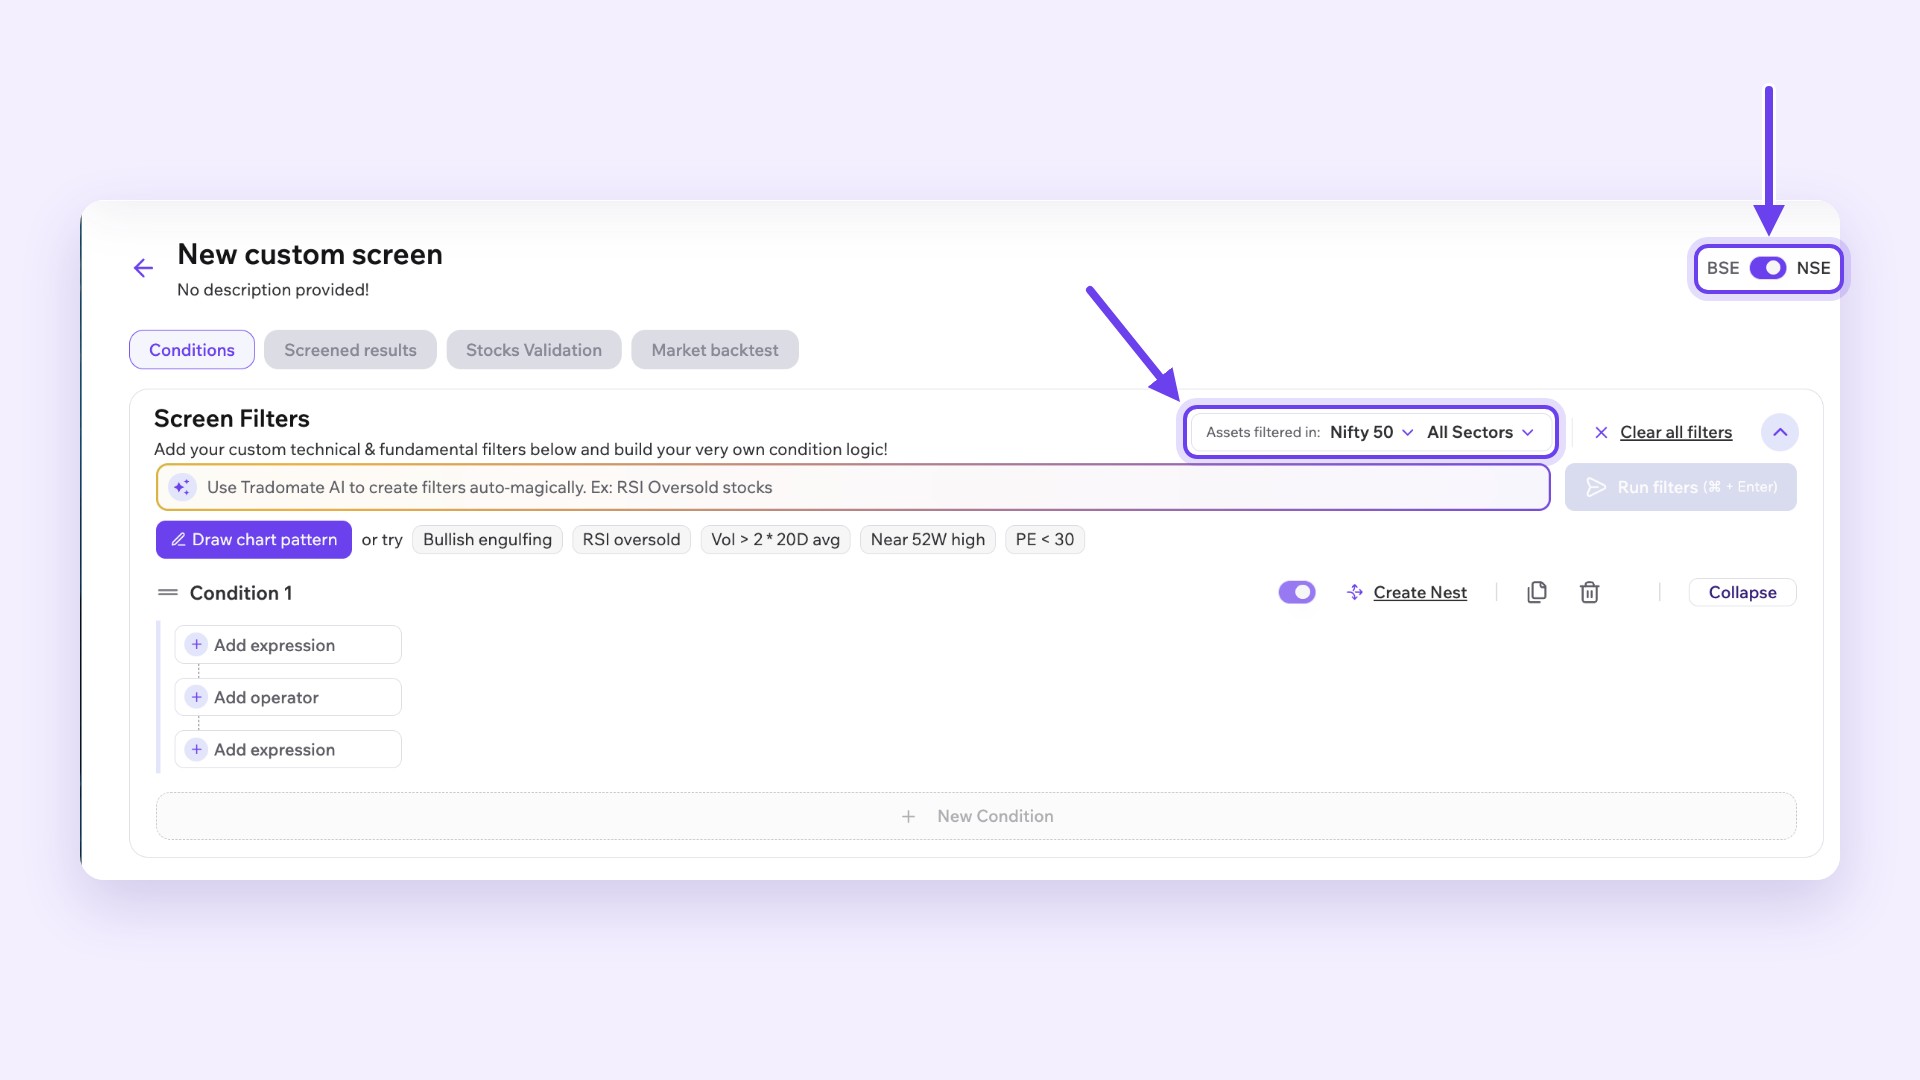
- Choose the stocks: Use “Assets filtered in” to pick which stocks to scan, such as the Nifty 50, and which sectors to include. The BSE and NSE toggle switches the exchange.
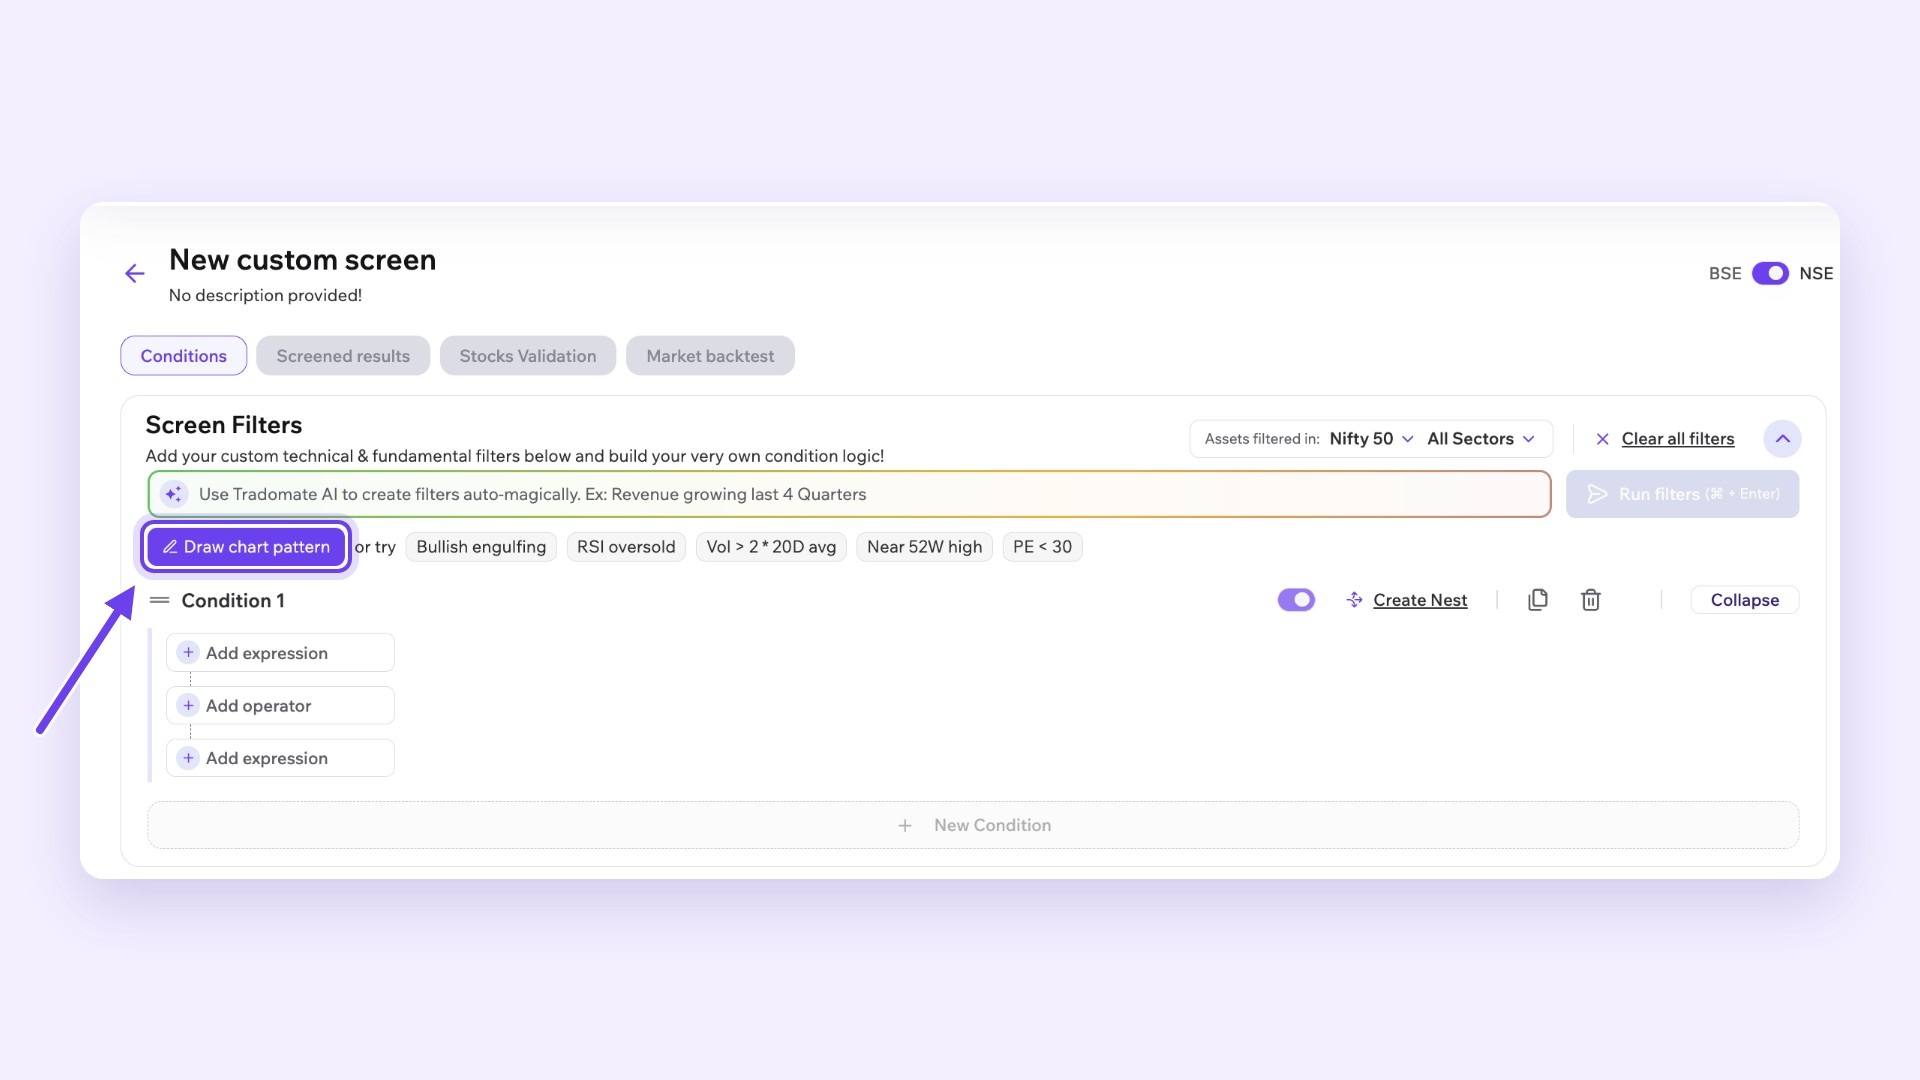
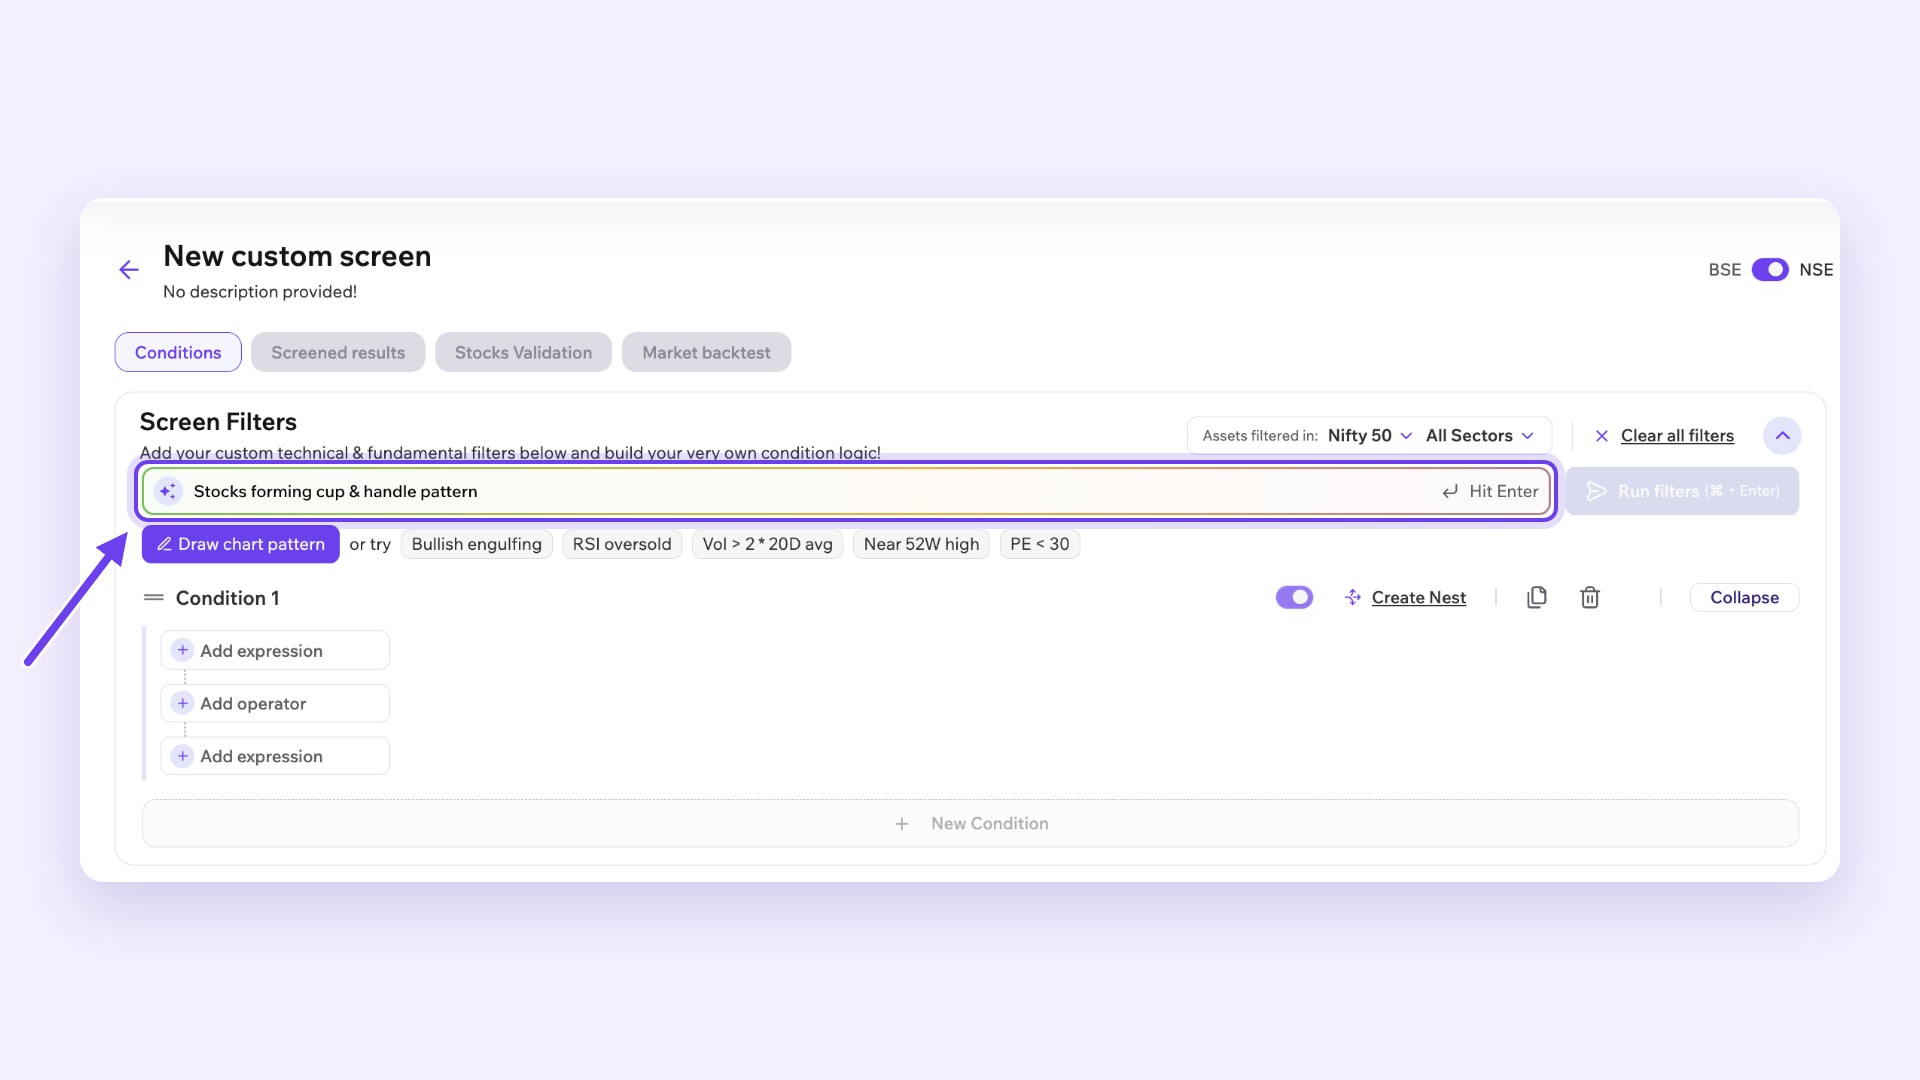
- Draw chart pattern: Click Draw chart pattern in the Screen Filters section. A Draw Pattern window opens, with Bullish Patterns and Bearish Patterns tabs.
- Select and apply: Select Cup & Handle in the Bullish Patterns tab, or draw your own shape, and click Apply.
- Gen AI bar: You can also simply type what you are looking for, such as “stocks forming a cup and handle”, in the Gen AI bar of the Screener, and it creates the filters for you.
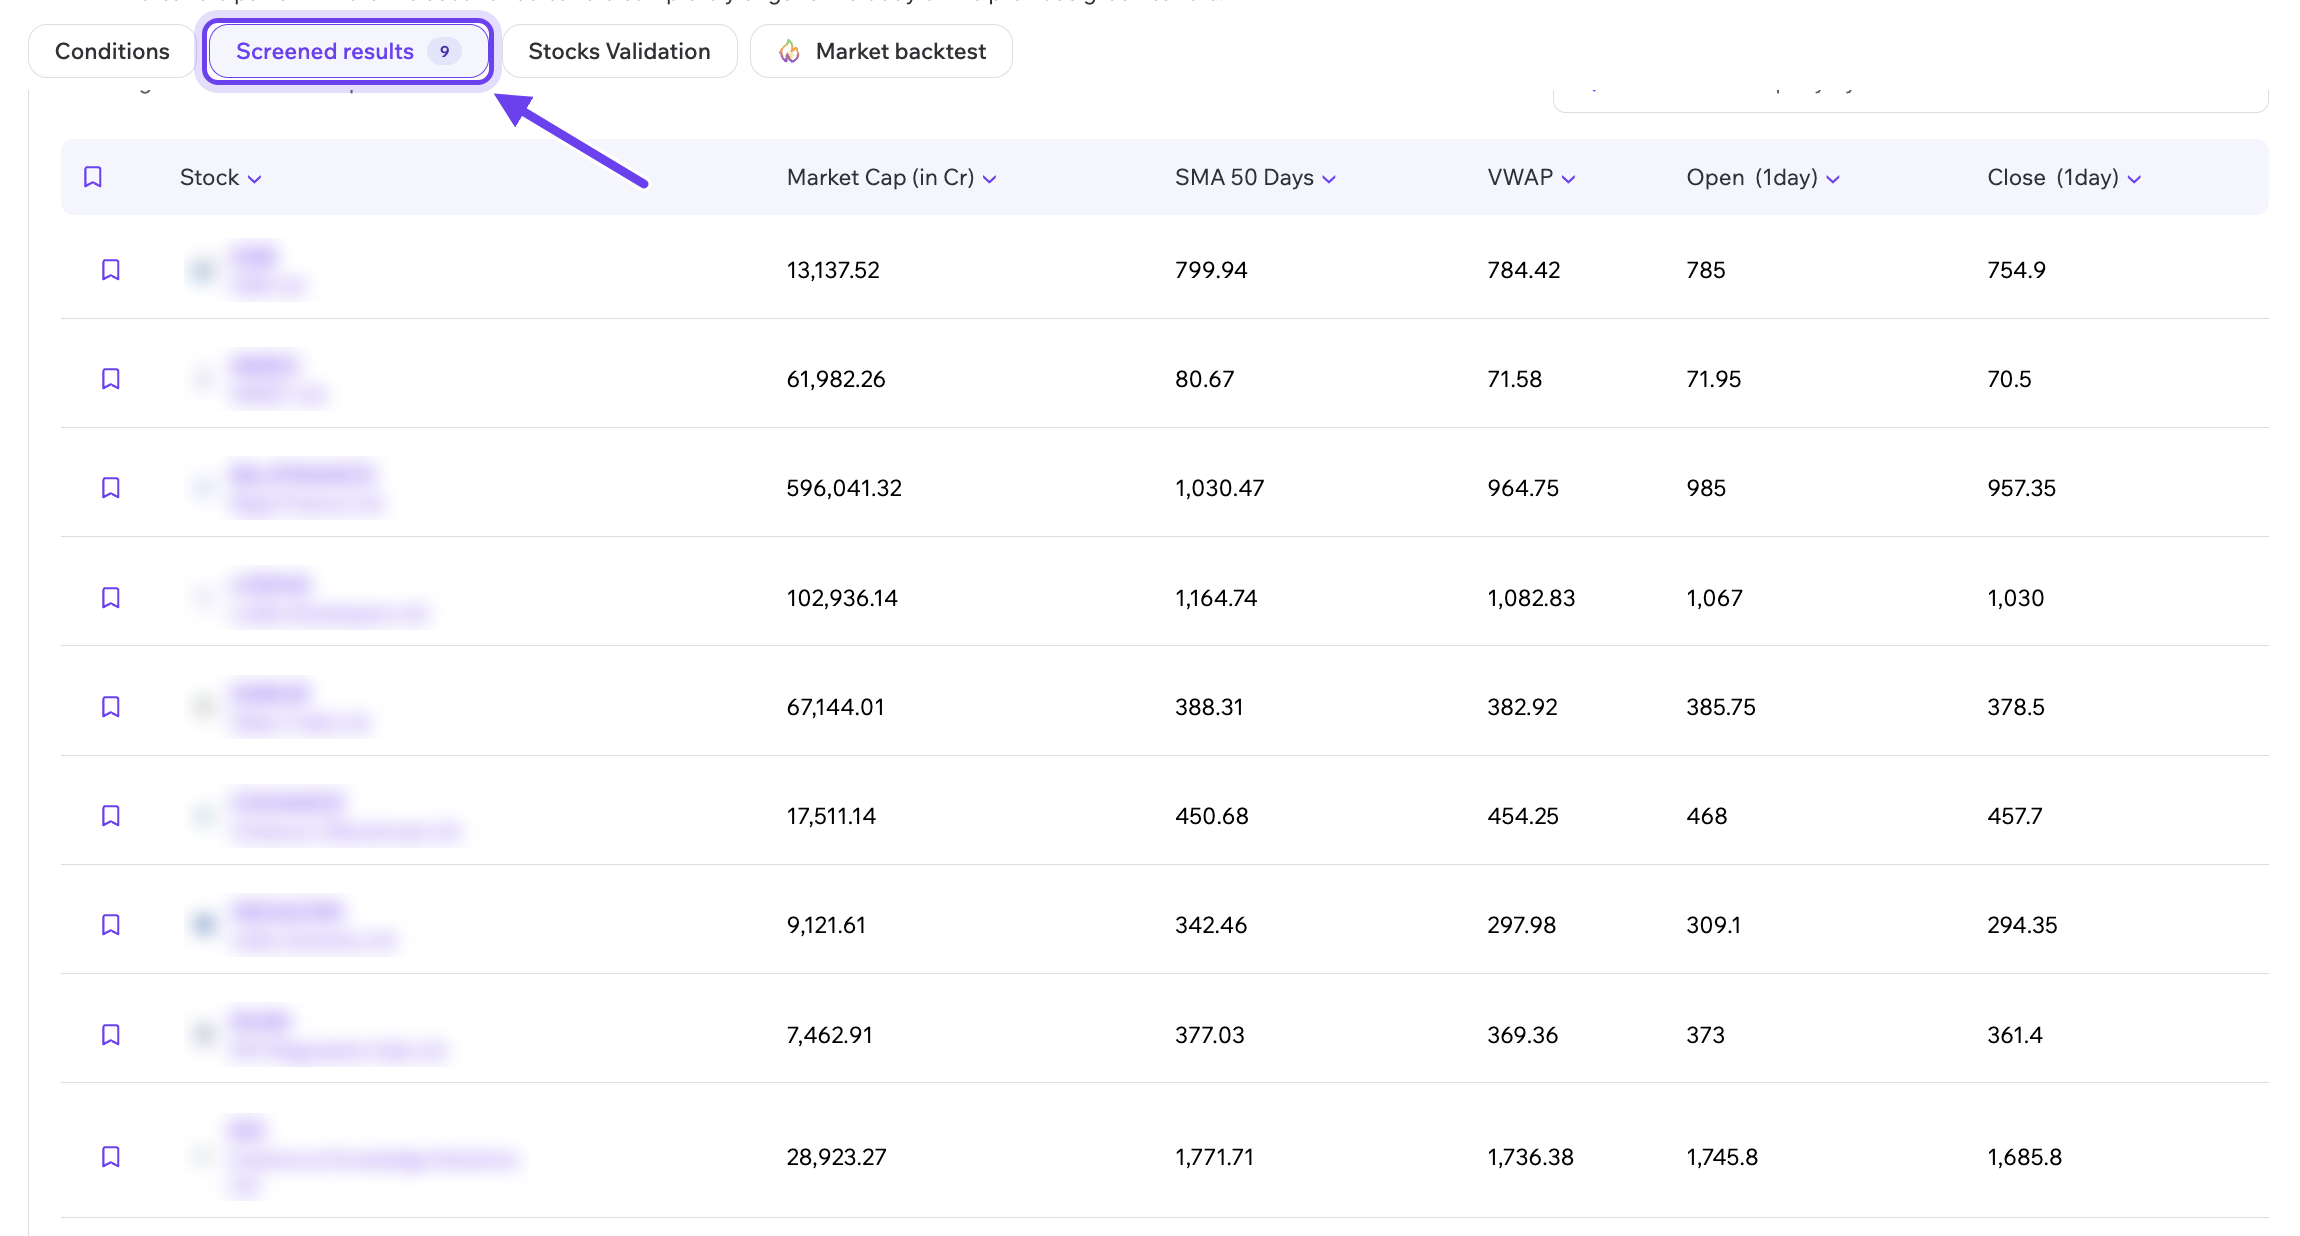
- Run filters: Click Run filters. The Screened results tab shows the stocks that match.
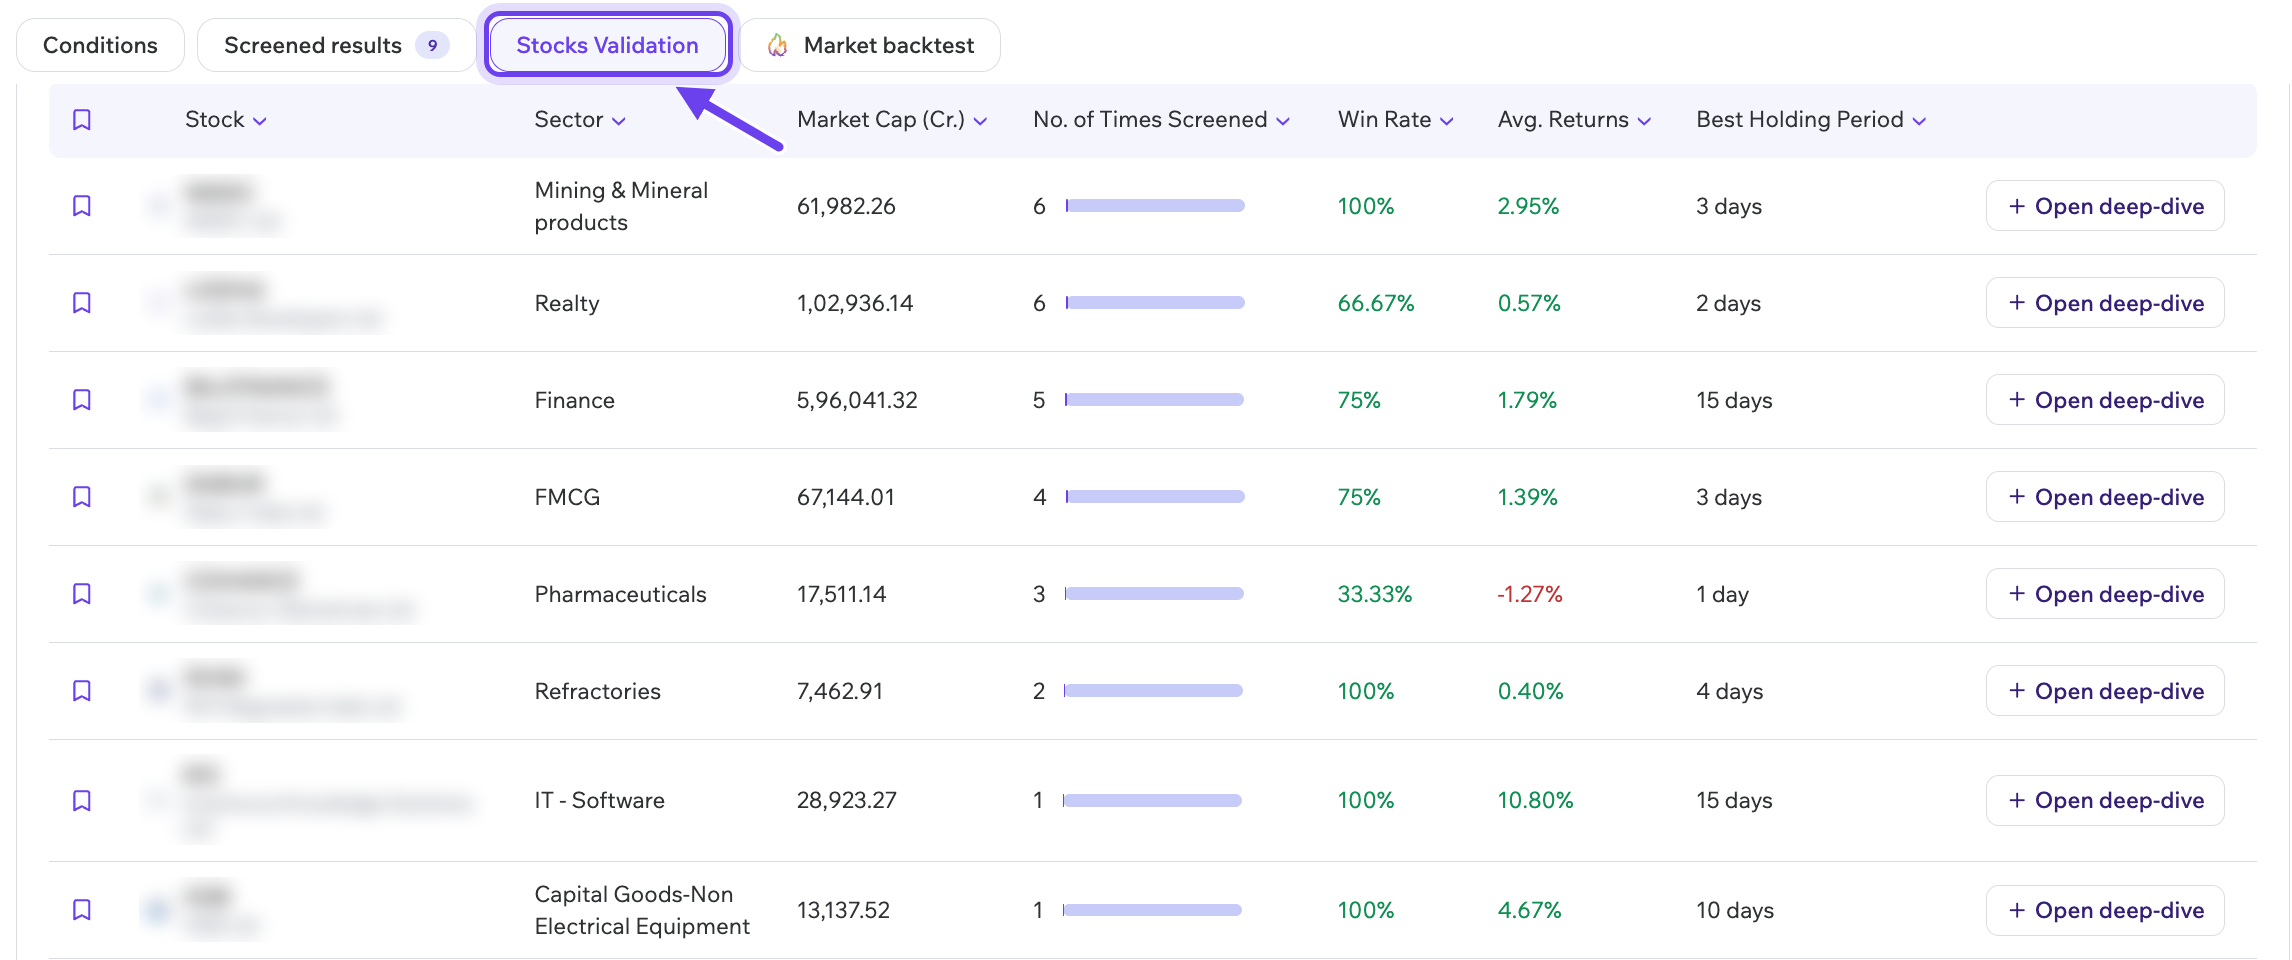
- Validate: The Stocks Validation tab shows how the screened stocks performed historically, and the Market backtest tab shows how your screen performs against the market.
Final Thoughts
The cup and handle is a bullish continuation pattern made of a rounded cup and a smaller handle, and a move above the handle’s high confirms it. A valid pattern has a U-shaped cup that gives back a third or less of the earlier rise, with a small handle in the upper half of the cup.
The pattern alone does not guarantee a move, so traders also look at how long the earlier rise has lasted, how volume behaves, and the mood of the overall market. On Tradomate, you can find the pattern on a single stock’s chart with Draw Pattern, or across many stocks at once in the Screener.
To read about more such patterns, click here to head to Tradomate’s blog section.
DISCLAIMER: This article is for educational and informational purposes only. It does not constitute investment advice or a research report.